
The Fast Flood model is a super-fast flood simulation tool. The method employs several unique algorithms to get over 97% accuracy compared to traditional modelling, 1500 times faster.
Developed originally in 2021, and expended and improved in the past years, the method is now available as a web-based model.
The standard version is available for free, without download or account required. The Fast Flood Pro version gives more features, such as different height models, automated calibrations, automated forecasts, designing storms and more.
The tool can be used to automatically download the relevant data from global datasets, or upload your own data. The simulation app features mitigation design, coastal and fluvial boundary conditions, precipitation scenario’s, infiltration and more. Fast Flood simulates hazard maps directly using the Fast Flood method, but can also employ the industry-standard Saint-Venant equations sped up by adaptive mesh and improved numeric solvers. Calibration and validation is included in the simulation process through available observational data (e.g. flood extents for historic events, discharge/river stage time series, historic flood occurrences).
There are two key assumptions that should be kept in mind when using the model. The model features 2 methods, the rapid Fast Flood method, and a full traditional flood solver (1D-2D regular grid Shallow water equations solver). The rapid method predicts peak parameters (flood maps) and separates routing from floodplain inundation. Furthermore the Fast Flood app has the possibility to simulate mitigating measures, such as implementing a dam or a reservoir. With this model the effect of those measures can be simulated. Fast Flood can be used for enabled informed discussions, mitigation sketching, rapid assessment in constrained environments, data preparation and initial studies. It is the fastest flooding simulation tool in the world!
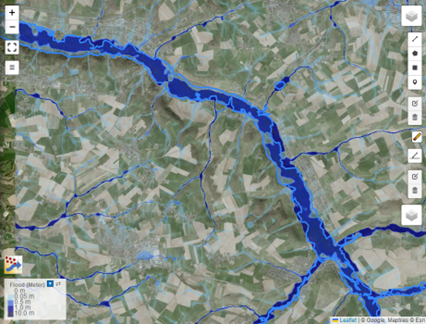
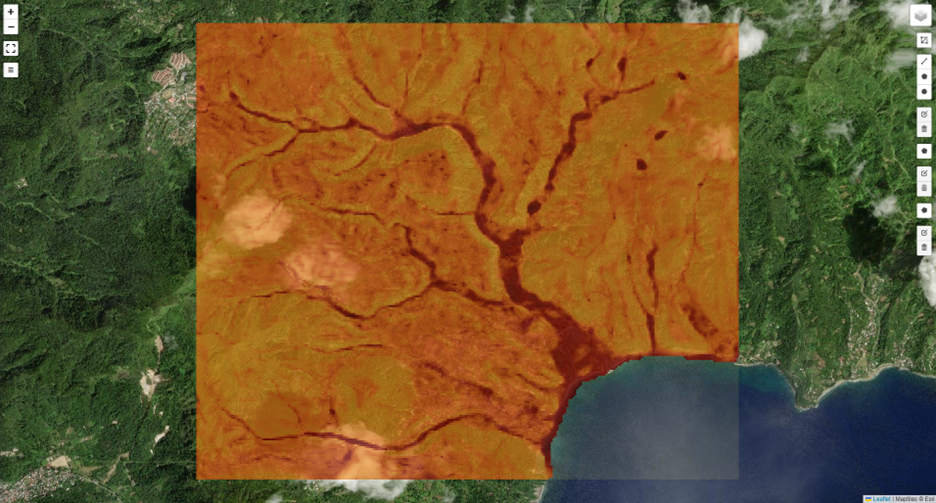
Showcases of this model can be found here
Fast Flood will be offered as an API interface, where you can call simulations to run in the cloud, and get back your results in record speeds! If you aim to implement the method in your own geospatial platform, or want to automate or operationalize the usage of the model, the API can help you do this efficiently.
The API for Fast Flood will become commercially available fall 2024.
It will work by means of a HTTPS POST request to our cloud endpoint.
This API entry point can run the model using your own data, or automatically selected data from global datasets. This API can either return to the caller directly, or after finishing the simulation. In case of returning directly, the API request will await for the model run to finish, which typically happens within several seconds.
Please find the draft API specification below. Note that this specification is subject to change until the official API is publicly released.
Required Input
And Either
– DEMDownload Dataset name (e.g. cop30, ahn, usned), Resolution (e.g. 10m, 20m, 40m, …) and Region, array of 4 numbers, representing upper left and bottom right coordinates of domain area. Can be in either lat/long or in Pseudo-Mercator projection coordinates
Or
– Elevation file URL A url linking to a geotiff file to be used as model elevation data input.
NOTE: The elevation data defines the model domain, size and resolution. This will also be the dimensions and resolution of the output, all provided in geotiff.
Optional Input
LandUseDownload Dataset name/Region to download, array of 4 numbers, representing upper left and bottom right coordinates of domain area. Can be in either lat/long or in Pseudo-Mercator projection coordinates
InfiltrationDownload Dataset name/Region to download, array of 4 numbers, representing upper left and bottom right coordinates of domain area. Can be in either lat/long or in Pseudo-Mercator projection coordinates
Note; All GeoJSONS have input coordinates in lat/lng coordinates
Output
List of urls where the results can be downloaded (…/flood.tif, …/discharge.tif, …./velocities.tif)